Introduction to Processor Bottlenecks
Processor usage (also called CPU usage) is the easiest bottlenecks for performance monitor to detect. What we are looking for is the percentage time that the processor is in use rather than just ticking over by running an idle thread. If the CPU is so busy that it cannot respond to requests, then the whole server's performance soon deteriorates rapidly.
Database and email servers are the most likely to suffer from processor bottlenecks. On the other hand, file and print servers are less likely to be short of CPU power. However, large modern servers invariably have multiple symmetric processors so % Processor Time bottlenecks are becoming rarer than memory bottlenecks. That reminds me, always monitor the other major counters, Disk, Network and Memory.
If you discover a processor bottleneck, then use the process counter in performance monitor to identify which program or process is hogging the server. Also check out drivers and disk subsystems to pin point the source of the processor activity.
Note: there are two Performance Monitor counters with very similar names, processor and process, on this page we are investigating processor (CPU).
Processor Topics
- Processor: % Processor Time
- System: Processor Queue
- Multiple Processors
- Other Processor Counters
- Solutions to processor problems
As a quick way of checking processor usage, call for the Task Manger, Performance Tab. Ignore spikes but check for high continuous CPU Usage History.
Processor: % Processor Time
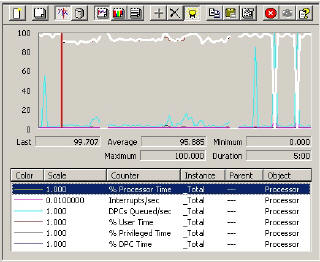
An overloaded processor has a distinctive and unmistakeable performance monitor profile. The % Processor Time trace looks like a curtain hanging down from an imaginary ceiling. See Diagram 1.
Text books quote thresholds of between 70 - 85 percent for % Processor Time, the key point is that the counter is continuously high. It is normal for the trace to show a sharp increase when any program executes; you can safely ignore spikes.
System: Processor Queue
The hardest part of using this performance monitor counter is remembering to go to the System object (not the Processor object). What I love about any queue counters is that it is easy to remember the threshold. The rule of thumb is that the threshold for a queue bottlenecks is 2.
Other Counters
You may also wish to examine DPCs Queue/sec. This is where the server was busy so it deferred processing a request. High or intermittent bursts of Interrupts /sec could indicate a hardware problem or a loose component.

No comments:
Post a Comment