Introduction to Disk Bottlenecks on Windows Servers
This page will explain how to use performance monitor to log disk counters. I will also recommend solutions to disk bottlenecks on Windows 2003 Servers.
Firstly, a homily to explain why you should always monitor these 'big four' objects: Memory, Processor, Disk and Network. Beware of monitoring one counter in isolation because that can lead to the wrong conclusions.
One company thought they had a problem with slow disks on a Windows 2003 Server. Performance monitor confirmed long queues and slow disk access times. Their conclusion was that the bottleneck was the disk and so they bought faster disks. Unfortunately, the slow response persisted and they called me in to investigate. By monitoring all the 'big four' performance objects, I found excessive paging, there was also less than 2MB of available bytes. The true ailment was lack of memory, high disk usage was a symptom and not the cause. The lesson: incomplete monitoring can mean a waste of time and money, so always record these four objects:- Memory, Processor, Disk and Network.
The Windows server roles most likely to experience disk problems are, web servers with lots of graphics and file servers. On the other hand, Domain Controllers, DNS, or DHCP servers are unlikely to have disk bottlenecks
Disk Topics
- Basic disk counters
- Disk Bottleneck - Queues
- Solutions to Disk problems
- Diskperf -y (New settings in 2003)
- Summary of Disk Monitoring
Basic counters to monitor disk activity
PhysicalDisk
- PhysicalDisk: Avg. Read Queue Length Should be less than 2
- PhysicalDisk: Avg. Write Queue Length Should be less than 2
- PhysicalDisk: % Disk Time more than 50% indicates a bottleneck
Disk Bottleneck - Queues 
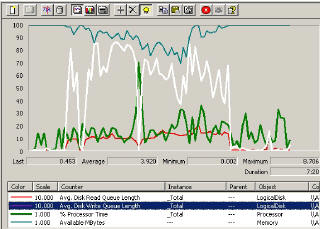
In Diagram 1 performance monitor shows classic symptoms of a disk bottleneck. My diagnosis is based on the Disk write queue counter, you can see that this queue averages more than 2. In fact the average is nearly 4 (with a peak of over 8).
I wanted to to be unbiased. So, to ensure that it was not a processor or memory bottleneck, I also recorded % processor time and available bytes. As you can see from Diagram 1, the processor's average was below 30%. If the processor were the bottleneck the trace would be over 80%. On the other hand, if there was a memory shortage, available bytes should drop below 10MB. The graph show there was always 70 MB of Available MBytes.
The performance bottleneck may be worse than the average figures above suggest. In Diagram 2, I have legitimately chopped the graph to isolate the period of intense disk activity. For these 5 minutes (4:46) the average is almost 6 against the bottleneck threshold of 2.
The other difference is that in Diagram 2 (taken from performance monitor), I have included % Disk Time, this exceeds 100% for the duration of the trace. In other words, the disk is working flat out writing data to to the hard drive.
There is one more deduction we can make from the queue data on the chart. If you compare the white line with the thick green line near the bottom, you can tell that the disk is writing more rather than reading. To see the diagrams more clearly, double click and expand the thumbnails into larger diagrams.

No comments:
Post a Comment